Monitor
When using IGServer, it is necessary to monitor the server's working status in real time and be able to access the monitoring records at any time when needed.
Server monitoring
 Function Description
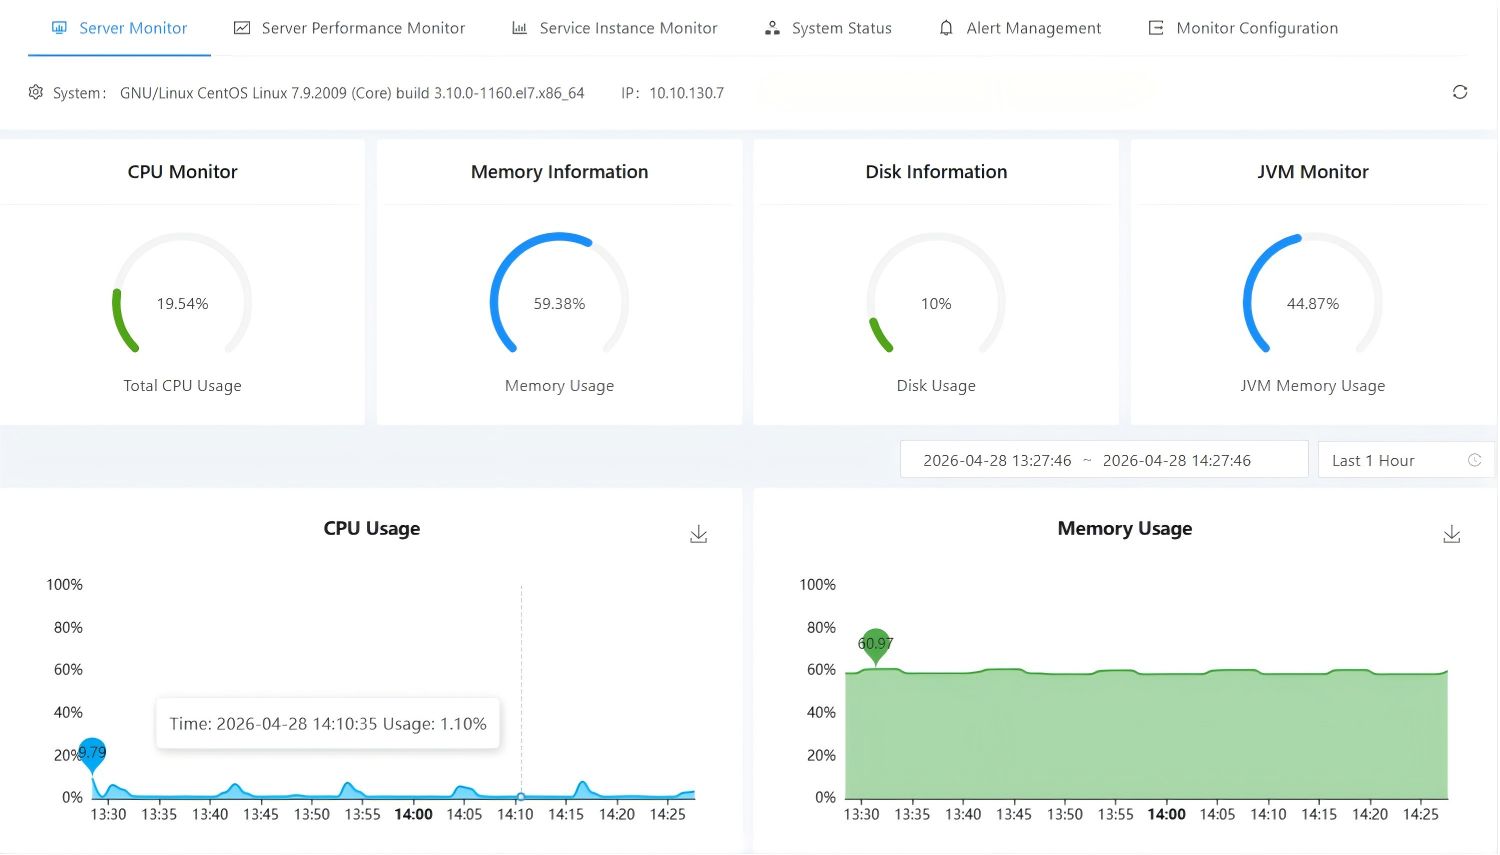
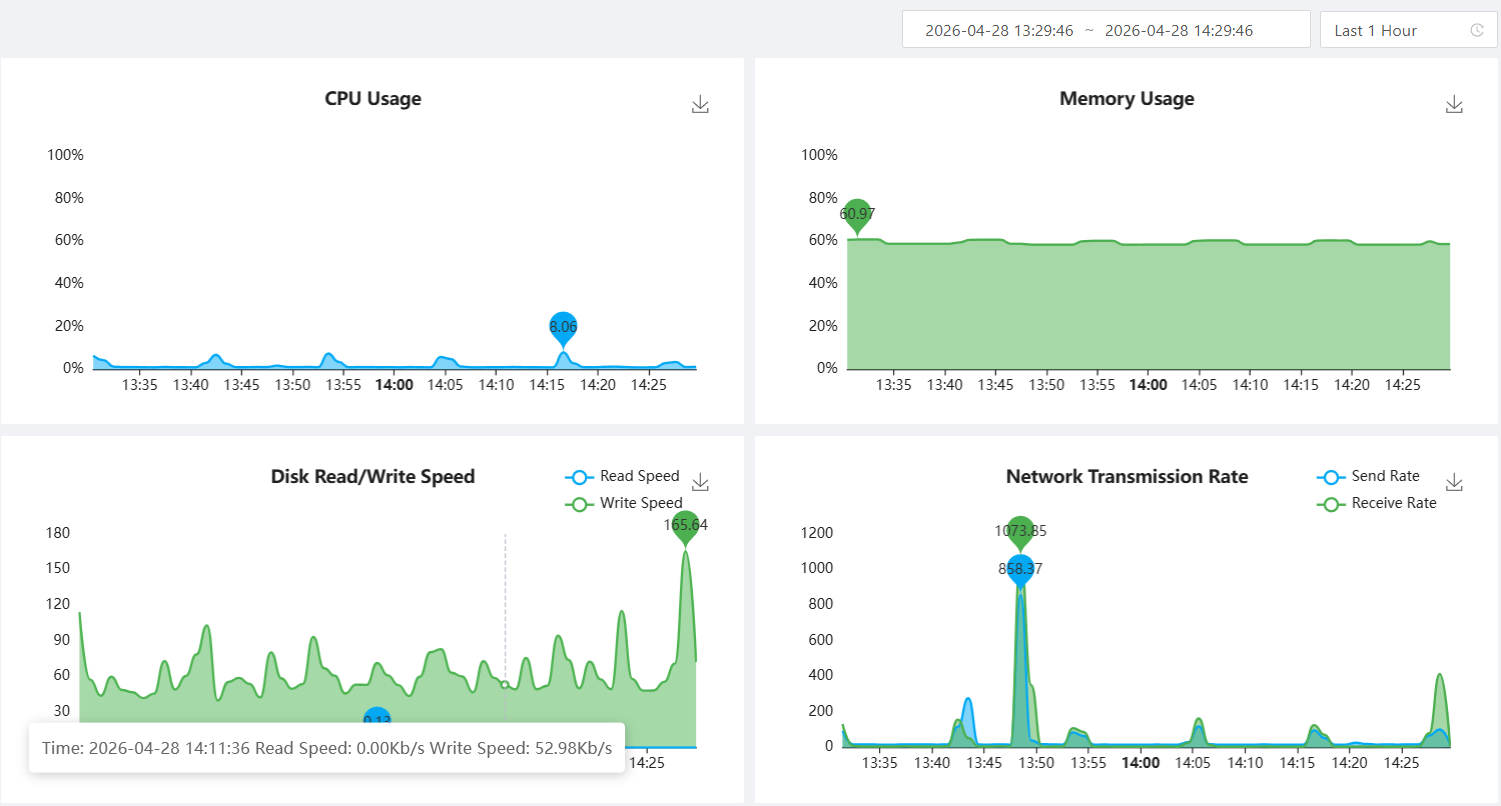
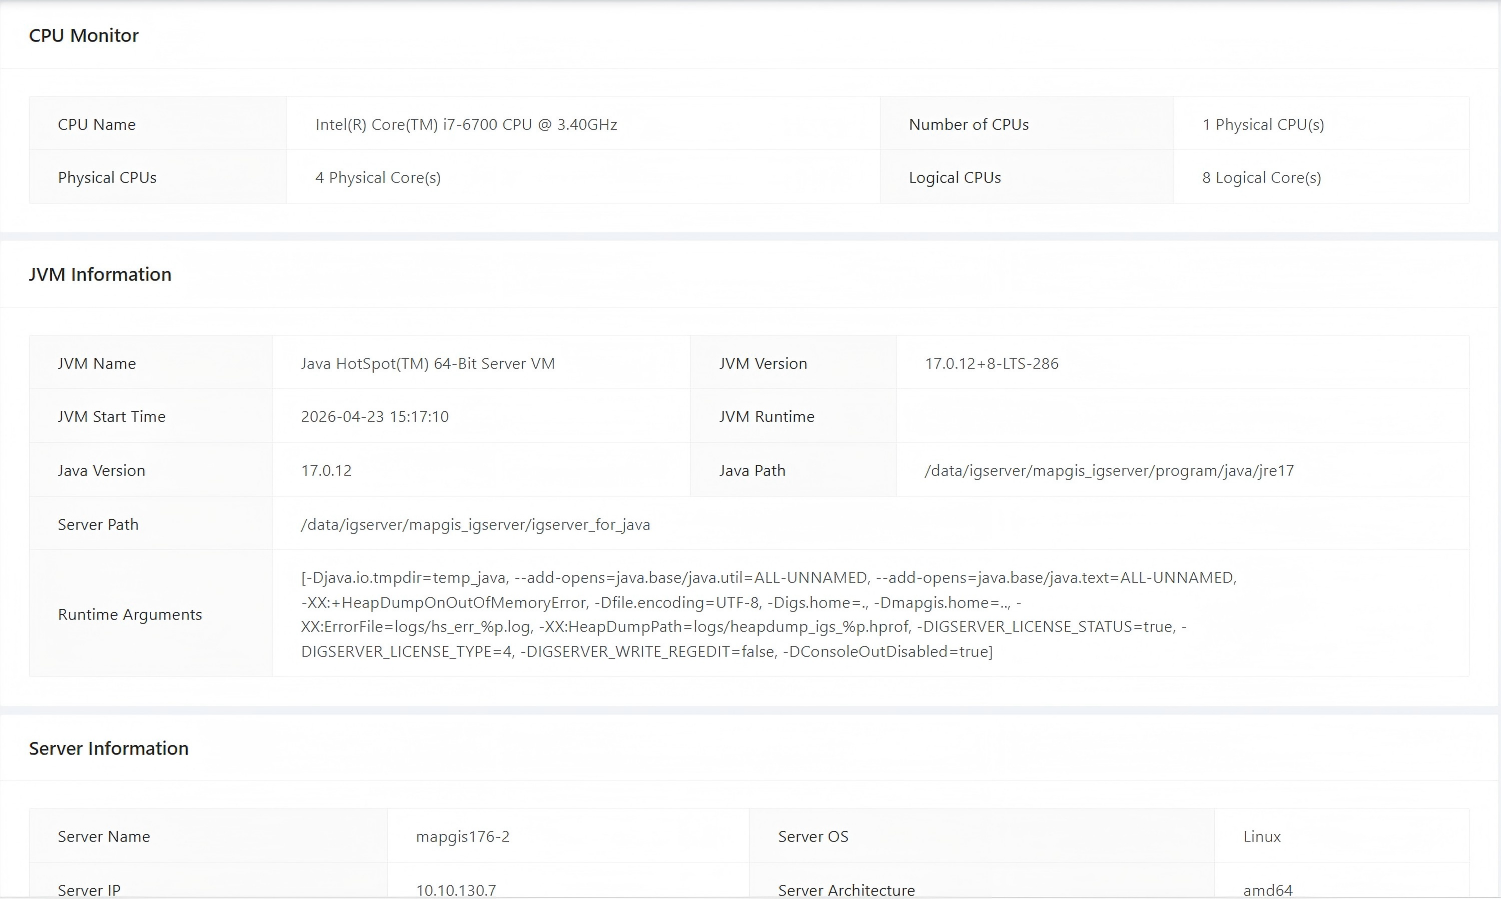
The server monitoring displays the computer performance of the IGServer client, including CPU utilization, real-time memory utilization, real-time read speed, real-time download speed, CPU monitoring, JVM information, server information, disk status, and other information.
 Operating Instructions
1. Switch to the " Monitor " - " Server Monitor " page, which will display the computer's real-time performance information;
2. Selecting the start date and end date will display computer usage performance information for the specified time period.
Server performance monitor
Function Description
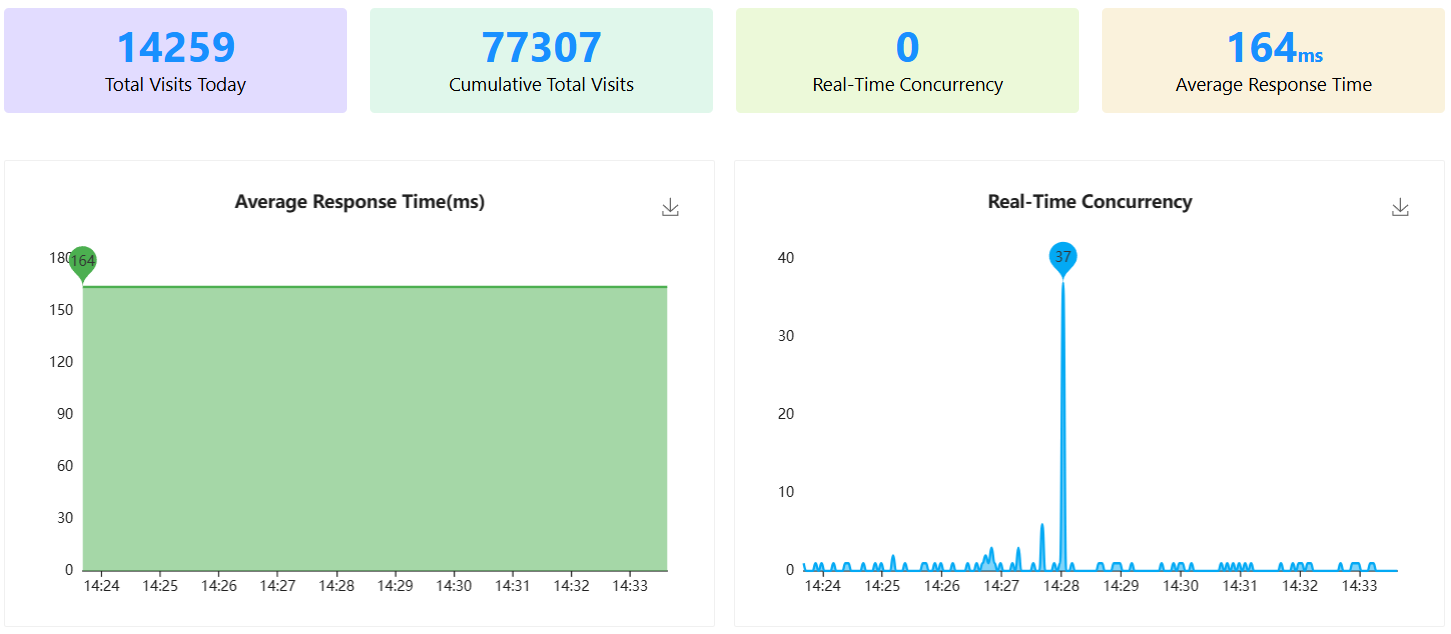
The server performance monitor displays service usage information for each service on the IGServer server, including today's total visits, cumulative total visits, real-time concurrency, and average response time.
Operating Instructions
1. Switch to the " Monitor " - " Service Performance Monitor " page. The page will display service usage information:
Service instance monitor
Function Description
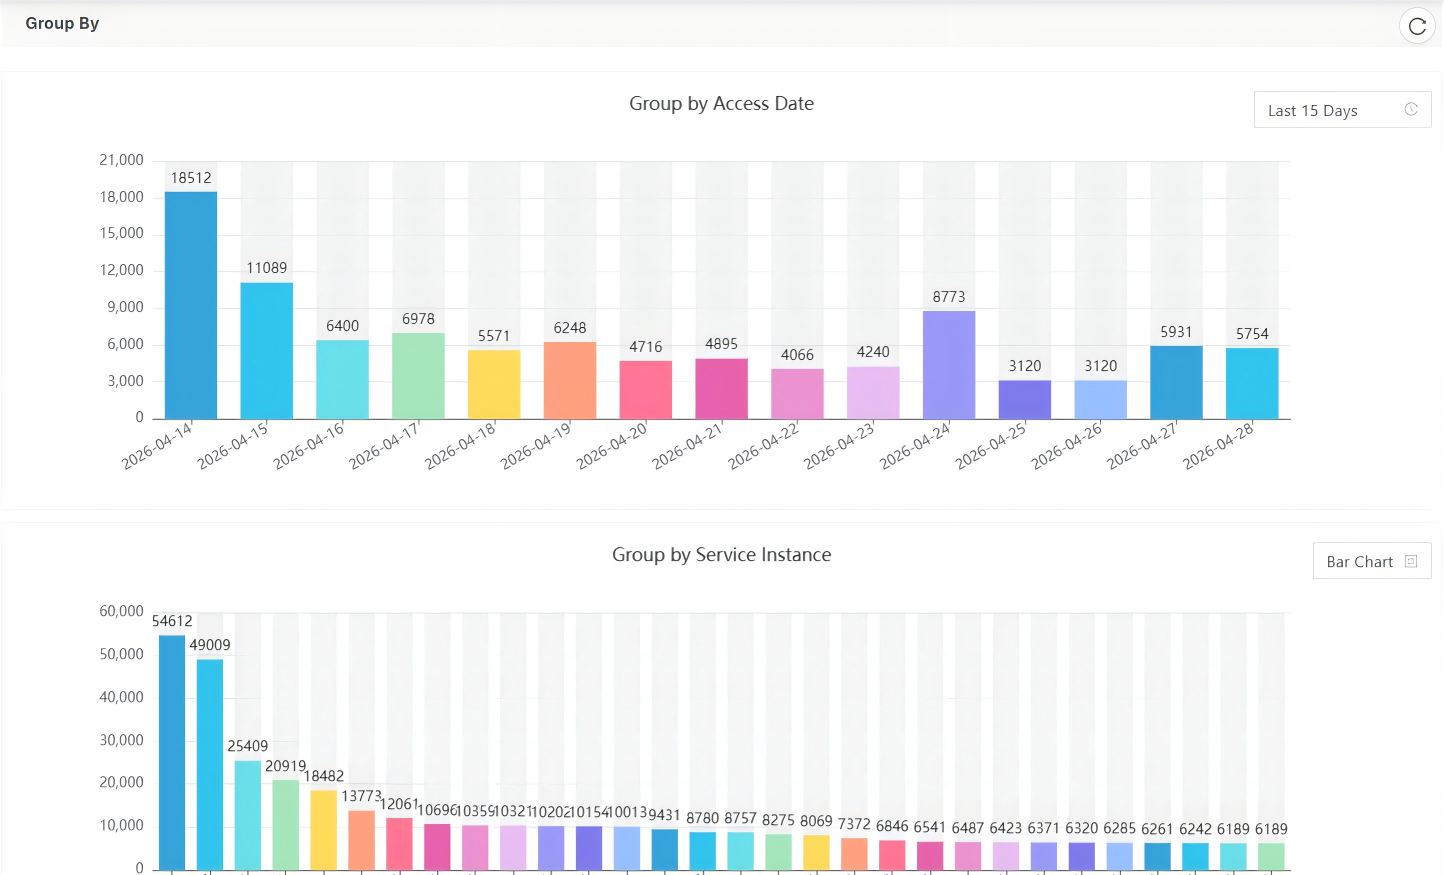
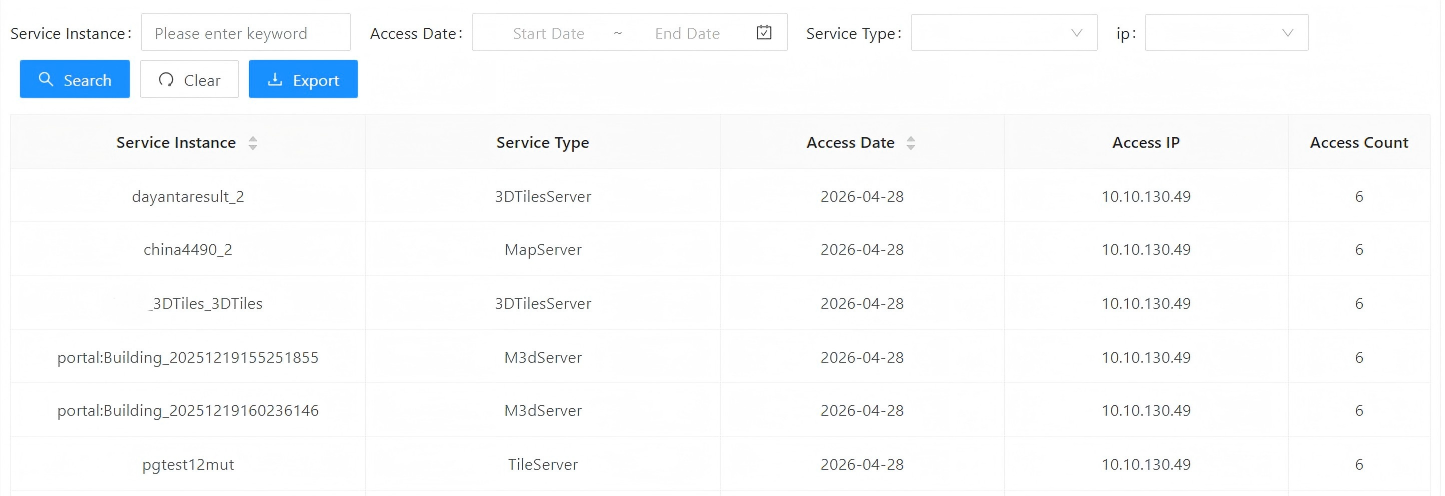
Service instance monitor provides grouped statistics and access information query functions for IGServer servers.
Operating Instructions
1. Switch to the " Monitor " - " Service Instance Monitor " page. The page will display access information group statistics:
2. Service access information can be queried.
System status
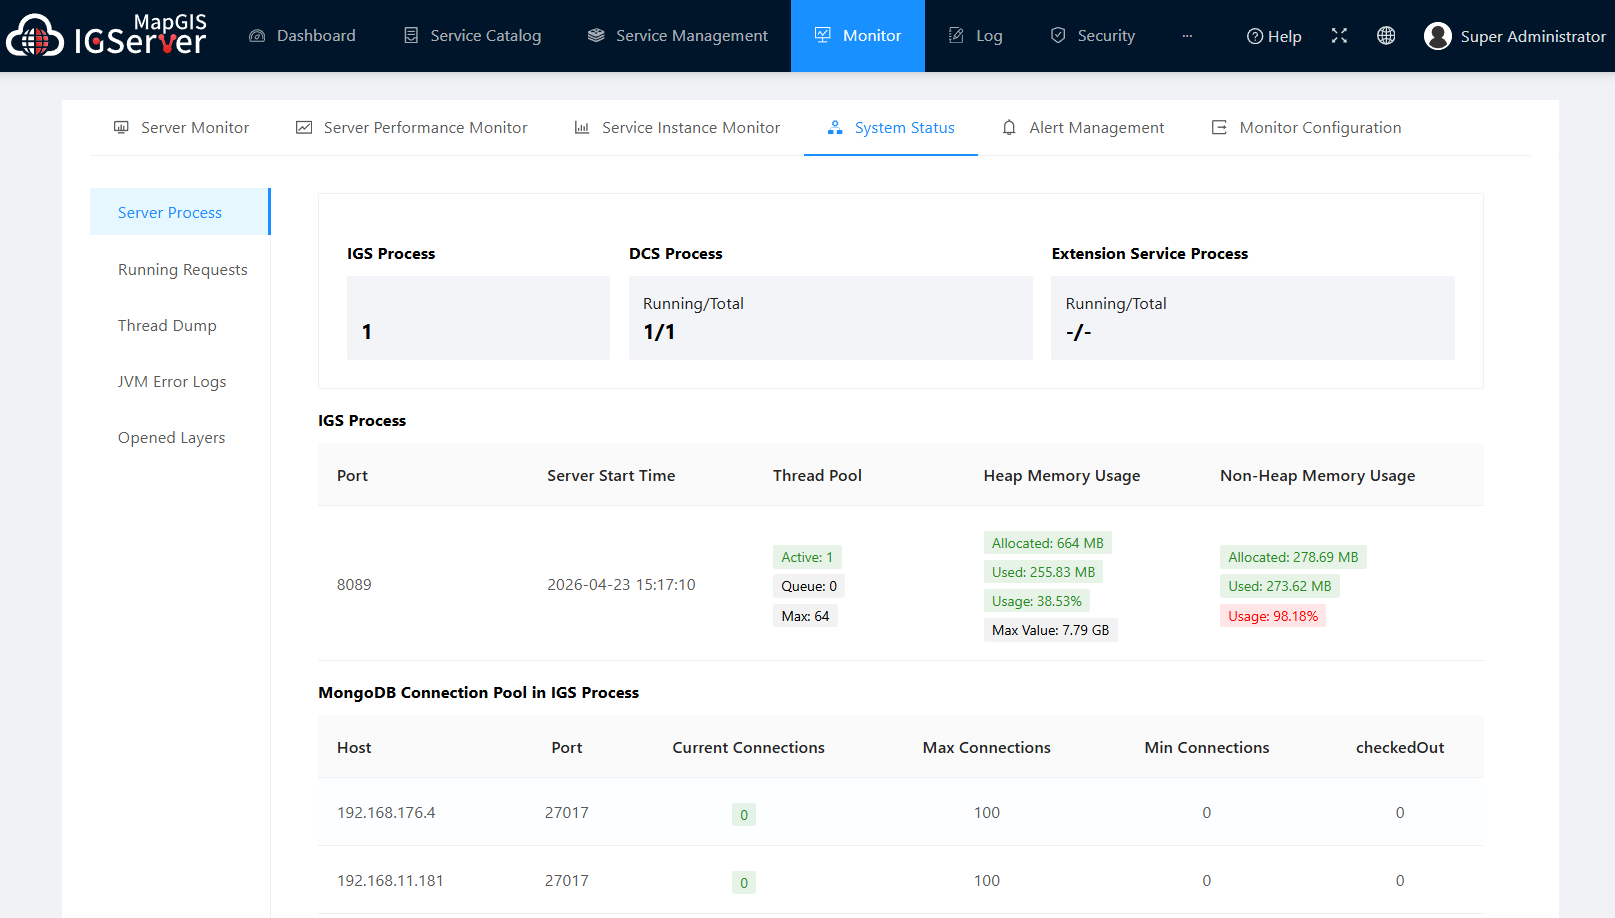
1. Service Process: Provides a display of the health status of various system processes, including the igs process, dcs process, extended service process status, thread pool and memory status of each process, and MongoDB connection pool status.
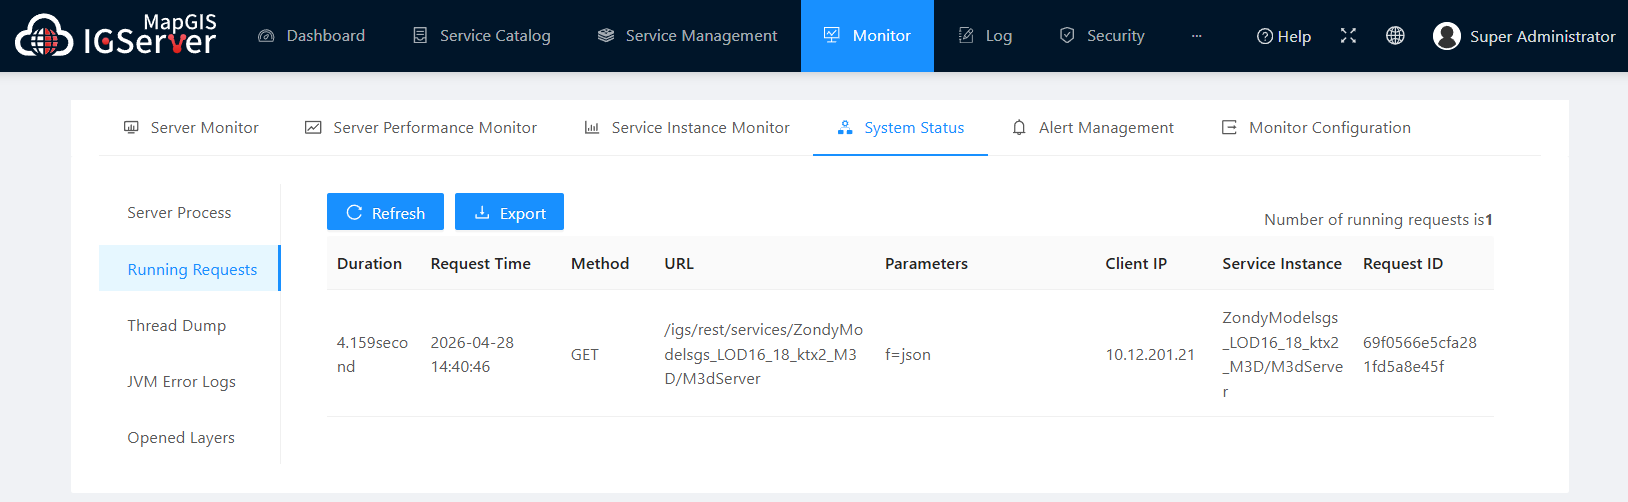
2. Running Requests: View and export information about requests that are currently being executed.
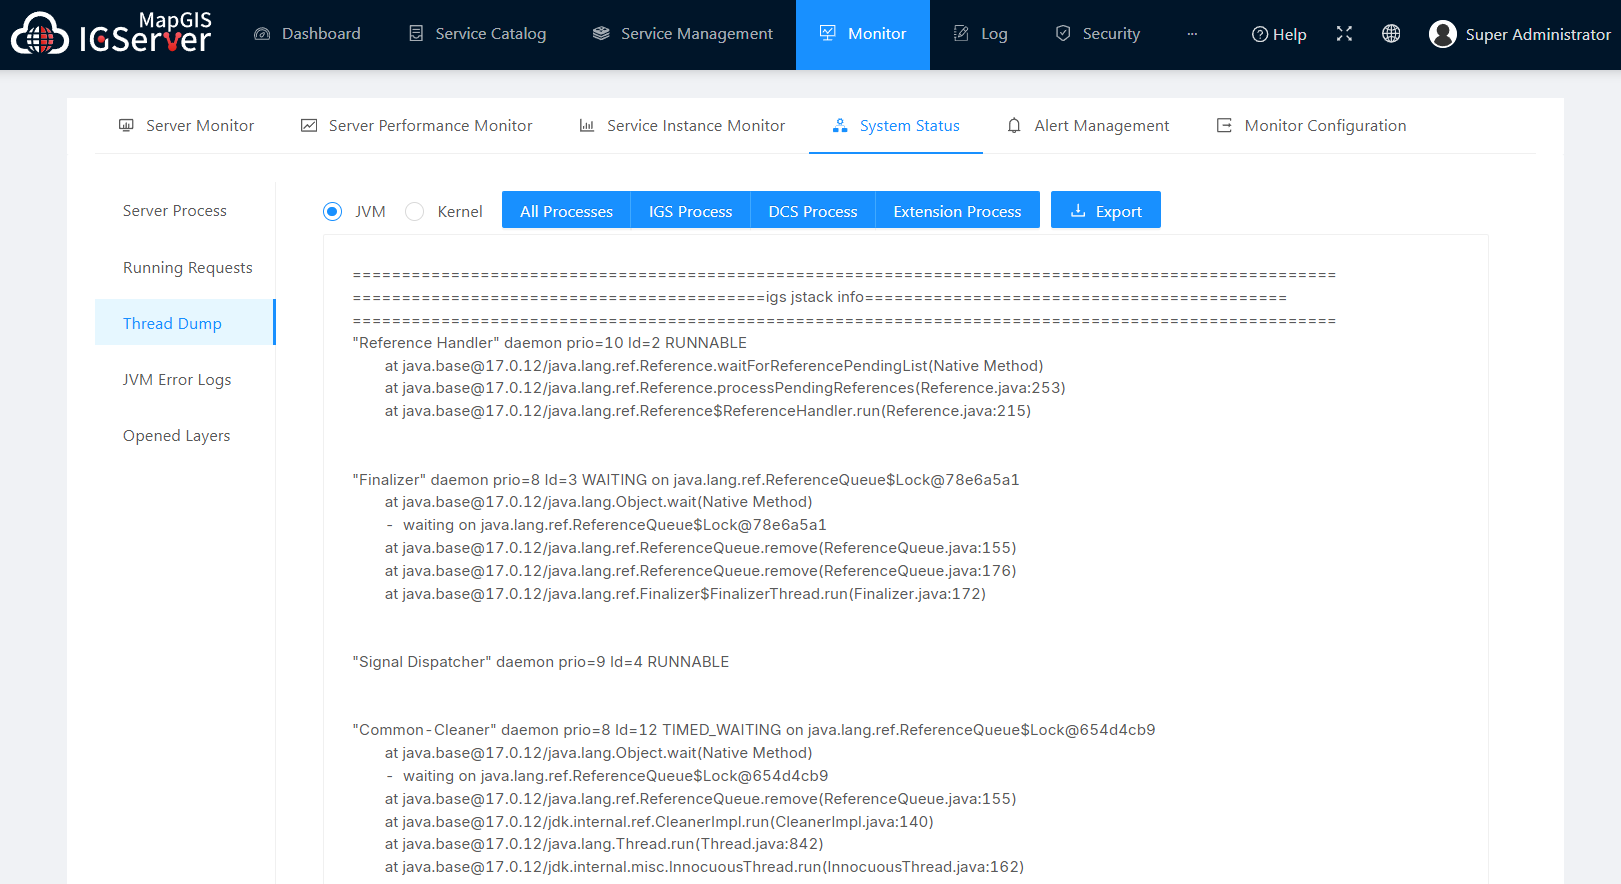
3. Thread Dump: Providing log printing for each process. This includes the IGS Process, DCS Process, and Extension Process.
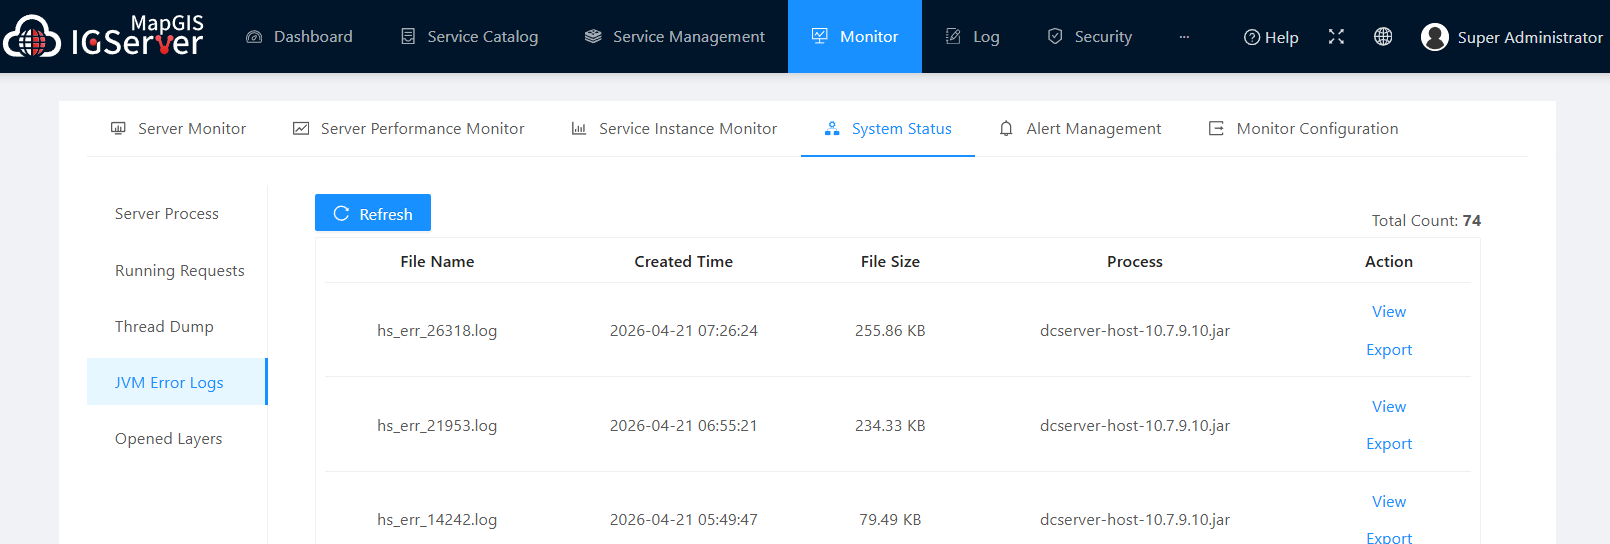
4. JVM Error Logs: All JVM crash logs can be viewed on the page. If the hs_err_pid.log file exists in the igserver_for_java/logs folder, it can be viewed on the page (you can manually copy the test file to the logs folder). Log content can be viewed with highlighting, and file export is supported.
Alarm Management
Function Description
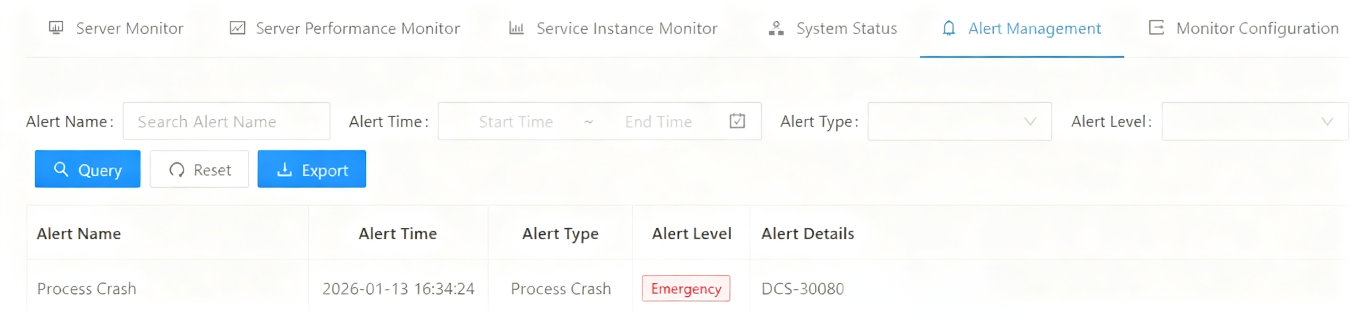
When the IGServer server encounters issues such as process crashes, thread pool fullness, slow HTTP requests, or slow DCS requests, the relevant information can be listed in the Alarm Management section. This allows users to monitor the normal operation of the IGServer server in real time.
Operating Instructions
1. Switch to the " Monitor " - " Alarm Management " page to list alarm information:
Monitor configuration
Alarm email notification
Tips:
Before configuring alarm email notifications, ensure that " Email Config " is set.
1. Switch to the " Monitor " - " Monitor Configuration " page, and click " Alarm Email Notification ":
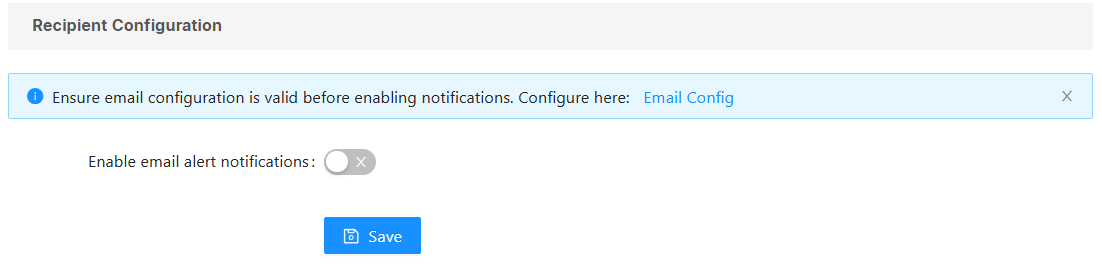
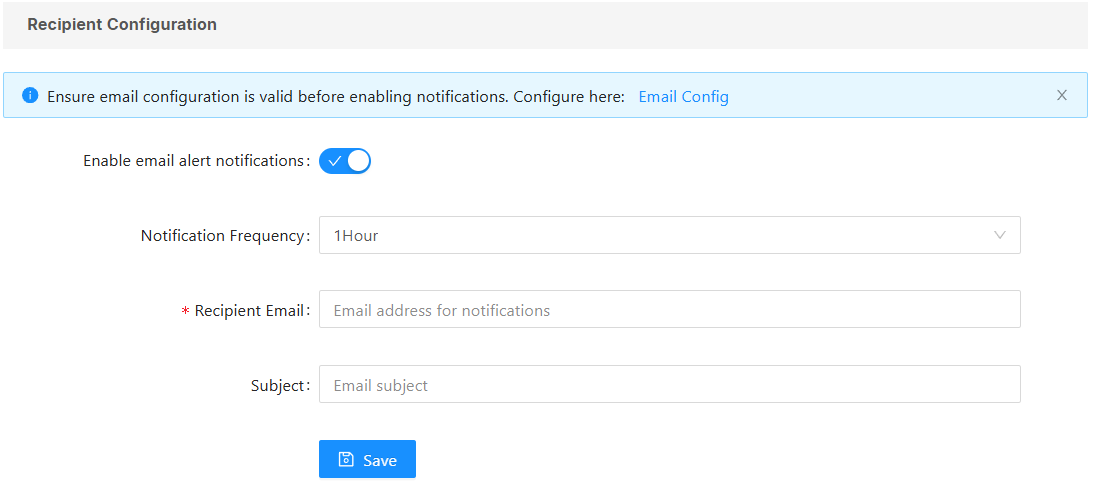
2. Enable email alert notifications, and you can set the notification frequency, email address, and subject information.
Exception log email alert
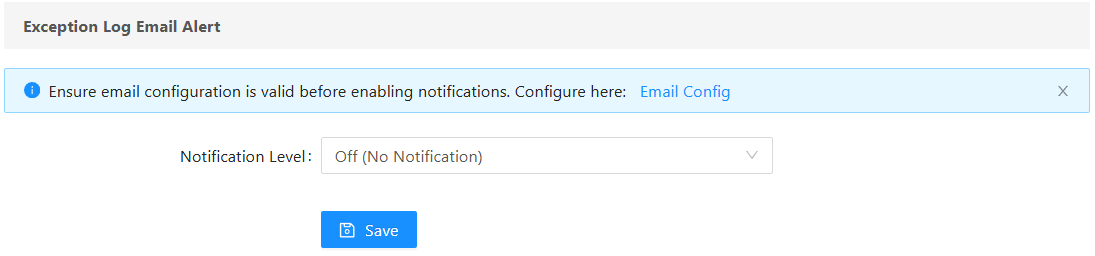
1. Switch to the " Monitor " page and click " Exception Log Email Alert " to set the notification level.
Exporter monitor config
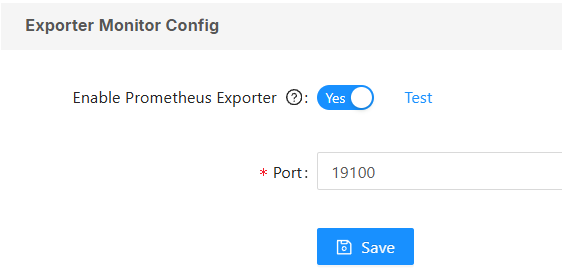
For third-party applications such as cloud management, Prometheus is used to monitor the IGServer server. On Windows, windows-exporter is started, and on Linux, node-exporter is started.
1. Switch to the " Monitor " - " Monitor Configuration " page, and click " Exporter Monitor Configuration ":
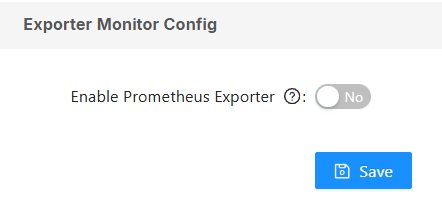
2. Once enabled, you can configure the port information.