
3D analysis
Vision
 Function description
This function can determine whether the points in the scene are directly visible to each other.
 Operating instructions
1. Go to the SceneViewer view, click the "Analysis  " function on the right toolbar, and switch to the "Sightline" panel:
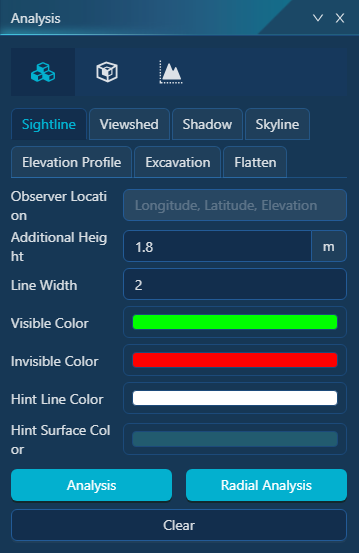
2. Set Sightline Analysis Parameter:
- [Additional height]: On the basis of the height of the interactive selection of the target point, the additional height;
- [Line width]: Set the line width;
- [Visual Color]: The line color of the visual part is green by default;
- [Invisible color]: The line color of the invisible part is red by default;
- [Hint line color]: Set the color of the ring transops analysis prompt line;
- [Hint Surface Color]: Set the color of the signal surface for the circular panoptic analysis.
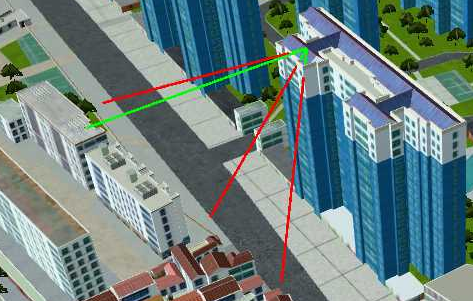
3. Click "Analysis" to interactively select the observation point and the target point in the scene view, and you can display whether the two points are visible in real time.
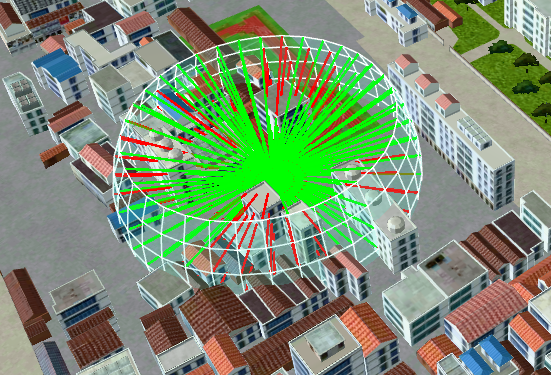
4. Click "Radial Analysis" to interactively draw the center and radius in the scene view to display the annular panorasic analysis results:
5. Click the "Clear" button to clear all analysis results in the scene.
Viewshed
Function description
Starting from a certain viewpoint, the visible and invisible situation within a certain spatial range in any direction.
Operating instructions
1. Go to the SceneViewer view, click the "Analysis " function on the right toolbar, and switch to the "Viewshed" panel:
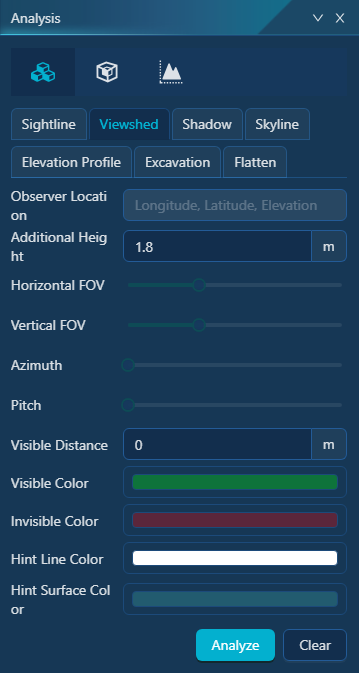
2. Set viewshed analysis parameter:
- [Additional height]: On the basis of the height of the interactive selection of the target point, the additional height;
- [Viewing FOV]: the angle at which the direction from the observation point to the target point is translated along the XY and Z axes respectively, which determines the horizontal and vertical distances of the viewing area;
- [Direction]: The angle of rotation from the observation point to the target point along the X and Y axes;
- [Observation point coordinates]: The XYZ coordinate value of the observation point is the starting point of the field of view, which can be selected interactively by the user in the view;
- [Target Point Coordinates]: The XYZ coordinate value of the target point, which is the end of the field of view, which can be selected by the user interactively in the view;
- [Additional height]: On the basis of the height of the interactive selection of the target point, the additional height;
- [Viewing Distance]: The farthest distance that can be viewed, the distance value from the observation point to the target point is used by default.
- [Area Color]: The color of the visible area and the non-viewable area is green by default, and the color of the non-viewable area is red by default.
- [Mask color]: visual mask color, translucent by default;
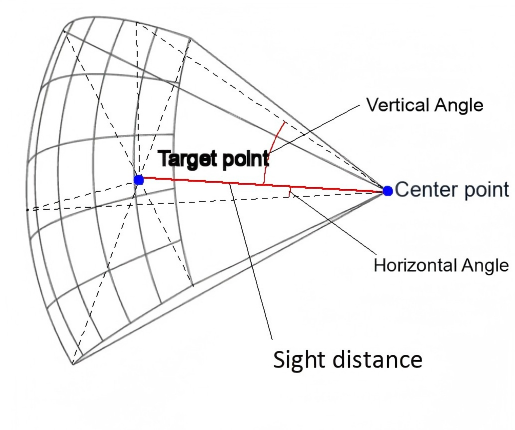
3. Click "Analyze", and interactively select the observer and target points in the view. The system will automatically read the coordinates, azimuth, and elevation angle of both points, and display the visibility information along the line of sight from the observer to the target.
4. Click the "Clear" button to clear all analysis results in the scene.
Shadow
Function description
Shadow analysis calculates the duration of sunlight a specified area receives over a given period based on its geographical extent. By configuring parameters such as maximum and minimum heights, sampling distance, and sampling frequency, the system generates lighting information for the area. The resulting daylighting value indicates the percentage of actual sunshine duration relative to the total time between the start and end times.
Operating instructions
1. Go to the SceneViewer view, click the "Analysis " function on the right toolbar, and switch to the "Shadow" panel:
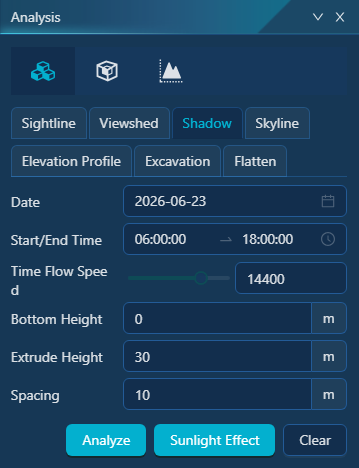
2. Users can set the following parameters:
- [Date]: Set the analysis date, which defaults to the current date. On different days, the sun's altitude angle is different, which will lead to different sunshine results.
- [Start/End time]: set the sunshine statistics time period;
- [Time Flow Speed]: the time elapsed rate that simulates the sunshine effect, the higher the value, the faster the time elapses;
- [Bottom Height]: Set the starting elevation of the shadow;
- [Extrude Height]: set the shade rate stretching height;
- [Spacing]: The smaller the spacing of the sampling points, the denser the sampling points.
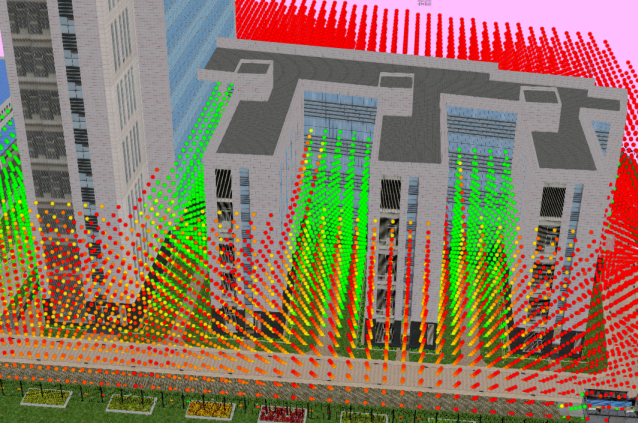
3. Click "Analyze" to interactively draw the polygon area in the scene view, and right-click to end the drawing. Several points can be used to represent the shadow rate of the area. As shown in the figure below, the red dot represents that the coordinate is always in a non-shaded state during the area time, and the green dot means that the coordinate is always in a shadow state during the area time.
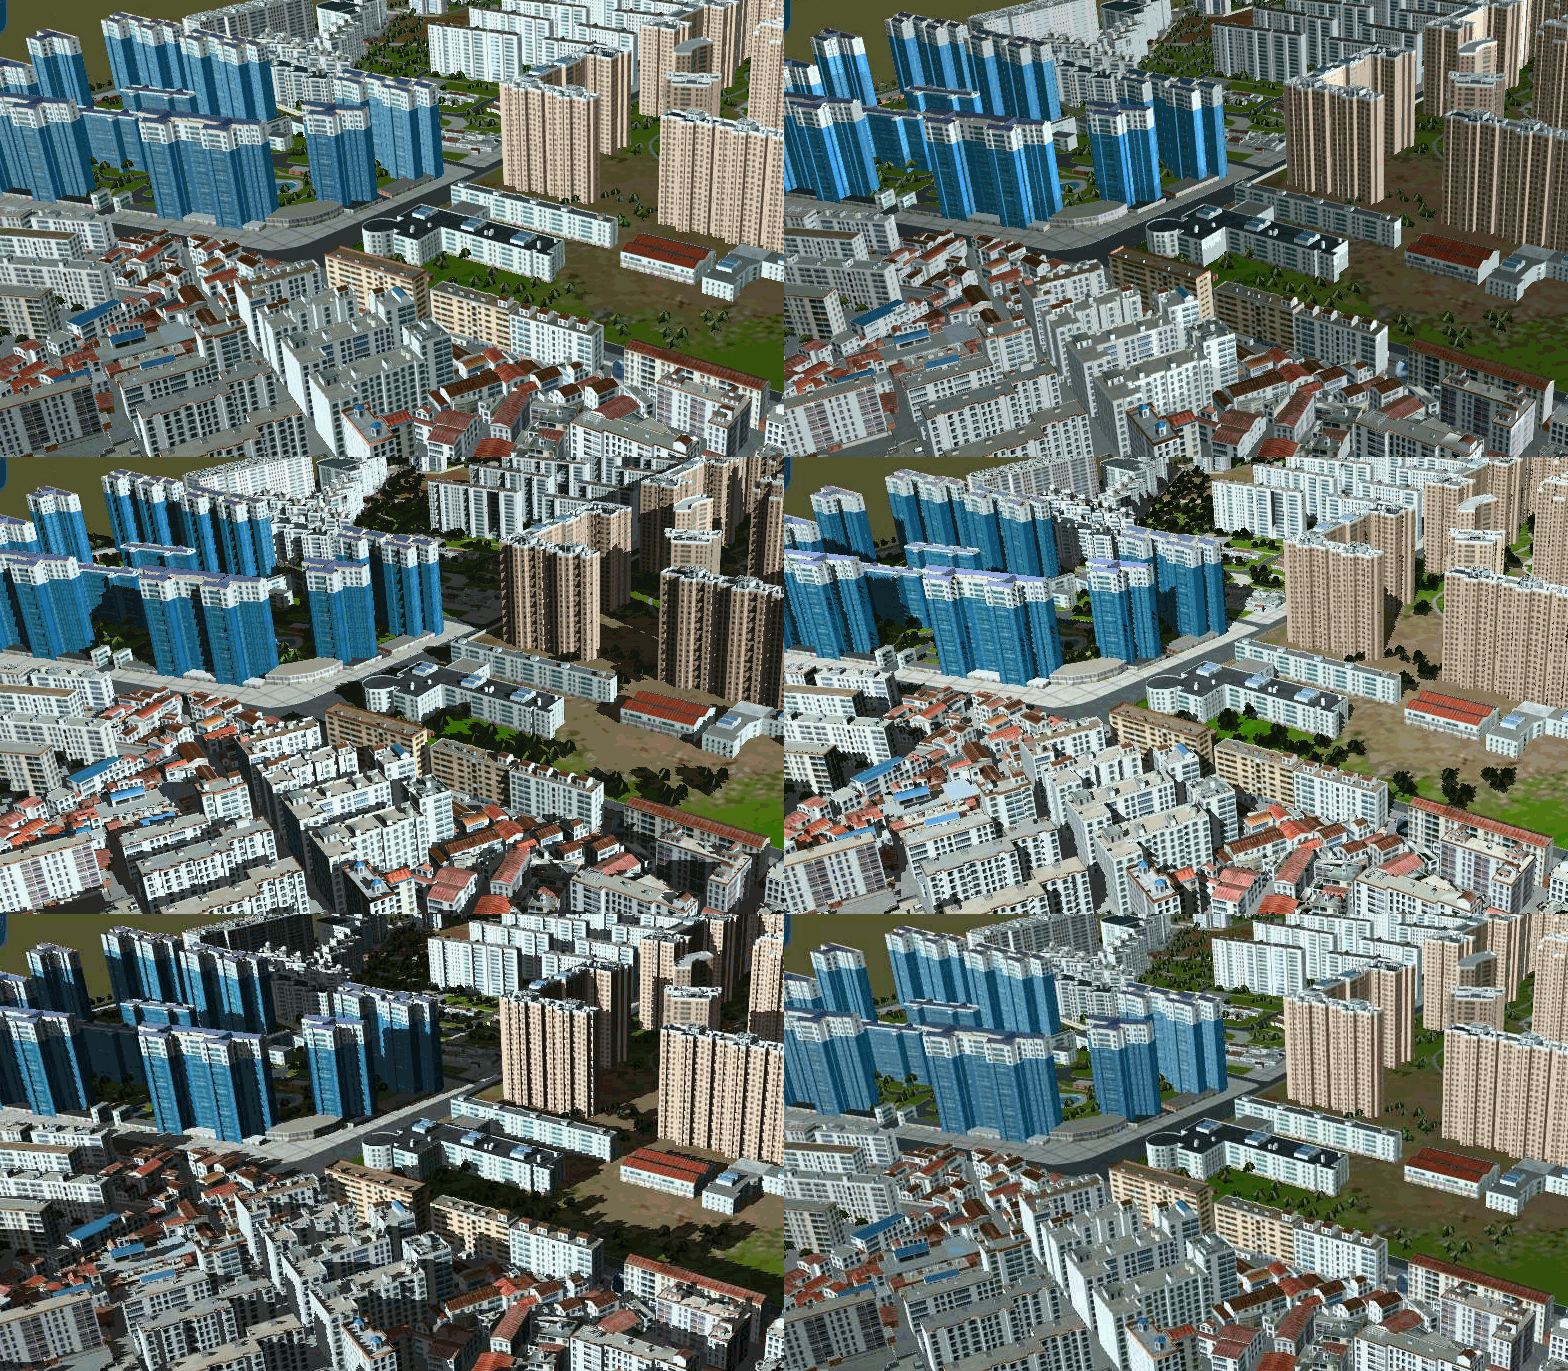
4. Click "Sunlight Effect" to simulate the shadow effect as time passes.
5. Click "Clear" to clear the shadow analysis effect.
Skyline
Function description
The skyline is an outline with the sky as the background composed of various topography and landforms and landmark features observed from a certain angle, which can be used as an important reference indicator for urban planning. Users can customize the viewing angle, and the system automatically generates a skyline based on the outline of the 3D model.
Operating instructions
1. Go to the SceneViewer view, click the "Analysis " function in the right toolbar, and switch to the "Skyline" panel:
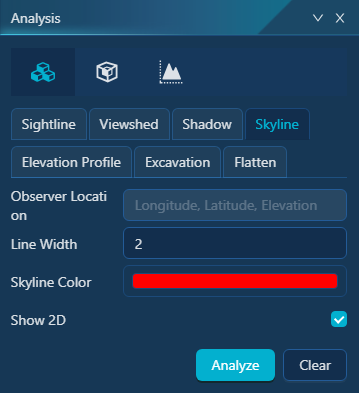
2. Users can set the following parameters:
- [Line Width]: The width of the skyline display in pixels;
- [Skyline Color]: The skyline displays the color;
- [Show 2D]: When turned on, it can produce a 2D skyline map.
3. Adjust to the appropriate display angle, click "Analyze" to generate a skyline.
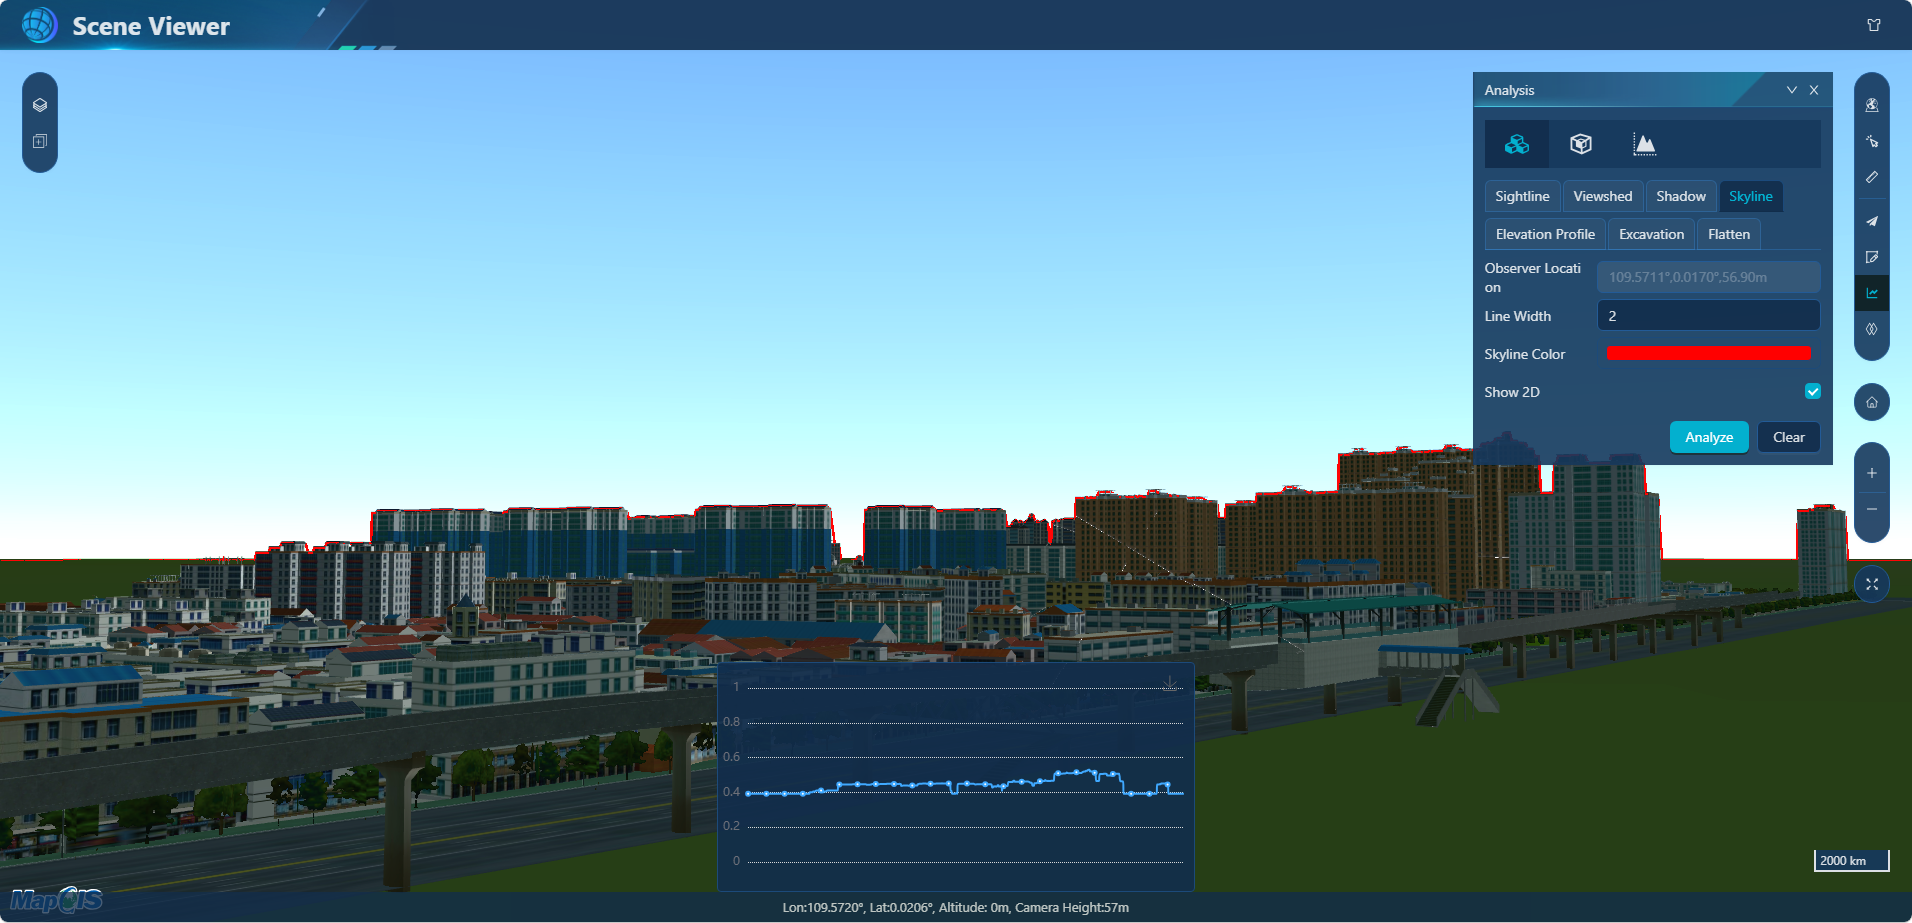
4. Click "Clear" to clear the skyline analysis effect.
Elevation Profile
Function description
Operating instructions
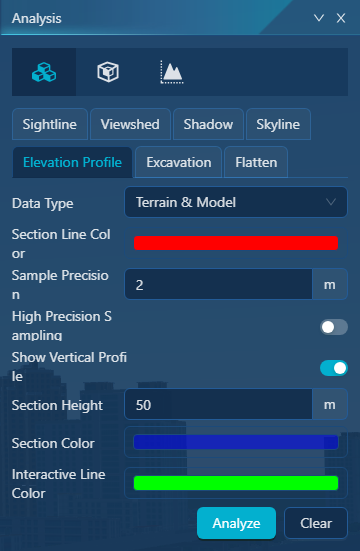
1. Go to the SceneViewer view, click the "Analysis { width=13 height=13 }" function in the right toolbar, and switch to the "Elevation Profile" panel:
Excavation
Function description
Simulate the 3D excavation effect by specifying excavation parameters and interactively drawing a polygon to excavate the area to a certain depth.
Operating instructions
1. Go to the SceneViewer view, click the "Analysis " function on the right toolbar, and switch to the "Excavation" panel:
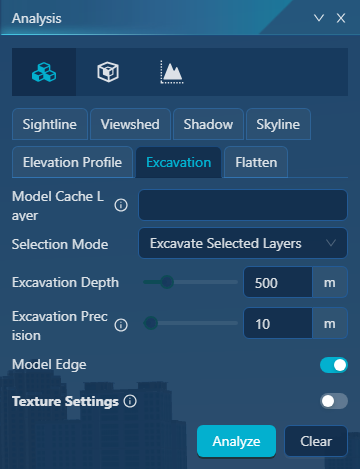
2. Select the model cache layer, here you can list all the layers in "Model Cache Layer", and you can select all or part of the layers for analysis.
- [Selection Mode]: Includes the following two methods:
- Excavate Selected Layers: Performing operations on the selected layers during excavation analysis, and not participating in the operation of unselected layers.
- Retain Selected Layers: operate on the unselected layer during excavation analysis, and the selected layer does not participate in the operation;
3. Set Excavation Parameter Information:
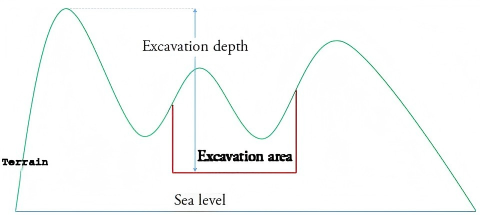
- [Excavation Depth]: Set the excavation depth. When terrain data exists, the excavation depth is the depth calculated downwards from the maximum height of the 3D data. When there is no terrain data, the terrain height is considered to be 0, and the excavation depth is based on 0 and then the depth of excavation downward.
- [Excavation Precision]: Set the excavation accuracy. When the terrain undulation in the excavation area is relatively large or obvious, the excavation accuracy can be increased, so that the excavation boundary undulation is smoother. Increasing accuracy will definitely affect the efficiency of analysis.
- [Model Edge]: When opened, the excavation side will be edged; On the contrary, the border is not sealed.
- [Texture Settings]: You can set the terrain and model sections and bottom surface texture effects.
4. Click "Analyze" to interactively draw polygons in the scene view to perform the excavation analysis.
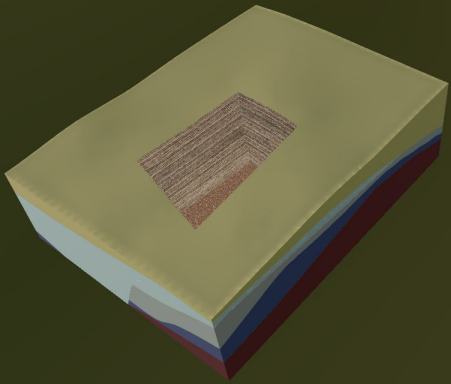
5. Click "Clear" to clear the excavation analysis effect.
Flatten
Function description
Model flattening, select the model data that needs to be flattened that has been displayed in the current scene, draw the flattening area interactively with the mouse, and flatten the model to the specified height according to the flattening height set by the user. It is often used for planning and design scenarios, and when some scenes need to be replanned, the area can be flattened through flattening analysis and then redesigned.
Operating instructions
1. Go to the SceneViewer view, click the "Analysis " function on the right toolbar, and switch to the "Flatten" panel:
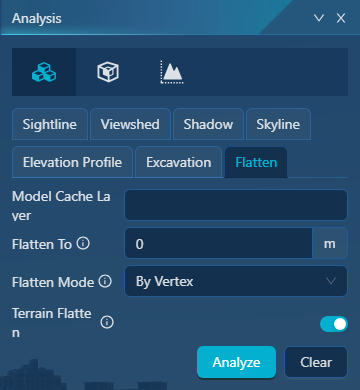
2. Select the model cache layer, here you can list all the layers in "Model Cache Layer", and you can select all or part of the layers for analysis.
3. Set the flattening parameter information:
- [Flatten To]: Set the height value after flattening.
- [Flatten Mode]: including the following two methods:
- By Vertex: the vertices of the model in the flattening area are flattened;
- By Featuer ID: All model features involved in the flattening area are flattened.
- [Terrain Flatten]: If Layer Management includes a terrain layer, whether the terrain is leveled synchronously. When opened, the flattening model operates on the terrain at the same time; On the contrary, the terrain is not flattened.
4. Click Analyze to interactively draw a polygon in the scene view to perform the flattening analysis.
5. Click "Clear" to clear the flatten analysis effect.