Graphing
 Function description
Users can interactively add embellishment elements in the scene, including points, lines, circles, rectangles, polygons, and text..
 Operating instructions
1. Go to the SceneViewer view, click the "Draw  " function on the right toolbar, and the following panel will pop up:
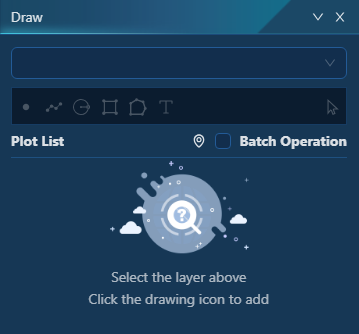
2. Click the drop-down box at the top of the page, enter a layer name, and click "Add Layer" to create a new layer.
Tips:
Layers can be used to manage the drawing drawings that are built, and you can create multiple layers to manage drawings for different business scenarios. When you add a drawing graph, you must first build a layer.
3. Select a layer and click Enter Graphic Type to add a drawing shape interactively in the scene view. The following types of graphics are currently supported:
(1) Point: You can left-click to draw a point interactively. The point parameter information is as follows:
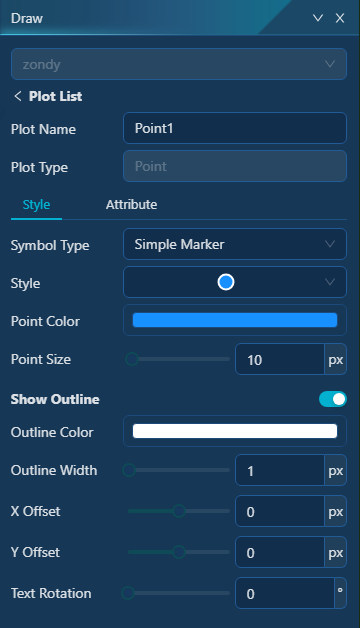
- [Plot Name]: Set the plot name.
- [Symbol Types]: The system provides two types of dot symbols: Simple Marker and Picture Marker:
Simple Marker: Adopts the system's built-in dot style.
- Style: You can pull down to select the built-in point style of the system.
- Point Color/Point Size: Set the dot color and size information.
- Show Outline: When enabled, you can display the point outline. You can set the color and width of the outline line.
Picture Marker: Use the image as a dot style.
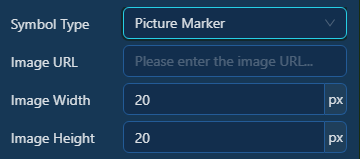
- Image URL: Enter the image resource address. Currently, MapGIS only supports HTTP/HTTPS image resources, and you can configure static file services such as Nginx to share image resources.
- Image Height/Width: Set the image height/width.
- [X/Y Offset]: The X/Y axis offset of the plotted point displayed relative to the coordinate point entered by the interaction.
- [Text Rotation]: The rotation angle of the plotted point.
(2) Line: Left-click the input line node, and double-click the left button to end the input. The line parameter information is as follows:
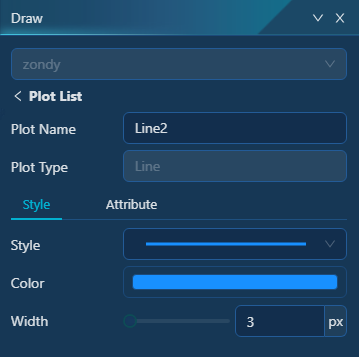
- [Plot Name]: Set the plot name.
- [Style]: Pull down to select the line style built into the system.
- [Color/Width]: Set the line color and width information.
(3) Polygon (circle, rectangle, polygon): The area parameter information is as follows:
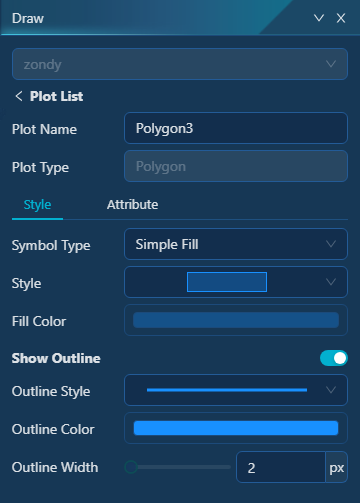
- [Plot Name]: Set the plot name.
- [Symbol Types]: The system provides two symbol types: Simple Fill and Picture Fill:
Simple Fill: Adopts the system's built-in fill style.
- Style: Pull down to select the system's built-in fill style.
- Fill Color: Set the fill color information.
- Show Outline: When enabled, you can display the outline of the area. You can set the color and width of the outline line.
Picture Fill: Use the image as the fill style.
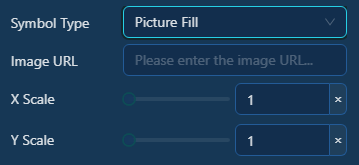
- Image URL: Enter the image resource address. Currently, MapGIS only supports HTTP/HTTPS image resources, and you can configure static file services such as Nginx to share image resources.
- X/Y Scale: Sets the X/Y zoom ratio when the image is filled.
- [Show Outline]: When enabled, you can display the outline of the area. You can set the outline style, color, and width information.
(4) Text: You can left-click to draw text interactively. The text parameter information is as follows:
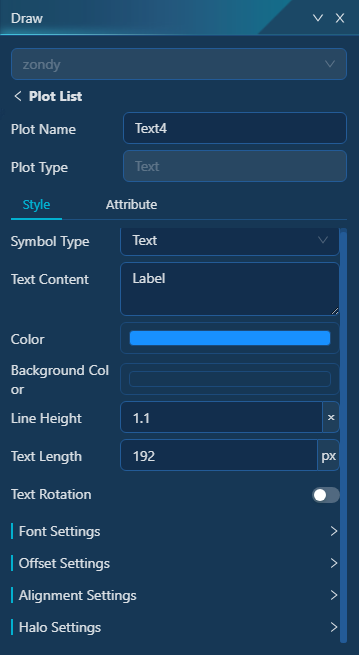
- [Plot Name]: Set the plot name.
- [Symbol Type]: The system provides two text types: Text and MapGIS Text:
Text: Adopts the cesium text style.
- Text Content: Enter the content of the standard order.
- Color: Set the text color.
- Background Color: Set the background color. The default transparency is 0, which means the display is fully transparent.
- Line height: Set the font line height. The line height information can only be reflected when the text is wrapped.
- Text length: Set the maximum length of the text in pixels. Line breaks will be automatically wrapped beyond this length.
- Text rotation: When enabled, you can set the rotation angle. The text is rotated according to the specified angle.
- Font settings: Set the font, font size, italics, weight, underscore, and other information of the text.
- Offset Settings: Sets the X/Y axis offset relative to the interactive input anchor when the text is displayed.
- Alignment Settings: Sets the horizontal/vertical alignment information.
- Halo Settings: Set the halo effect for the text, and you can set the halo color and size.
MapGIS text: Adopts MapGIS text style.
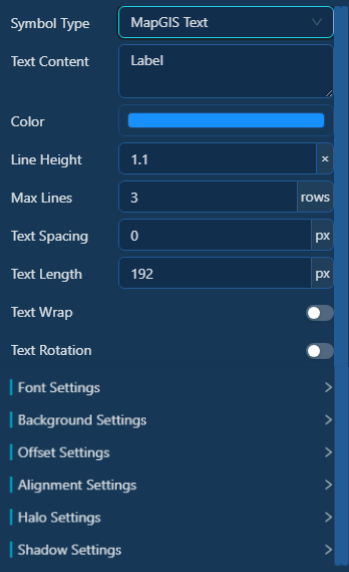
- Text Content: Enter the content of the standard order.
- Color: Set the text color.
- Line height: Set the font line height. The line height information can only be reflected when the text is wrapped.
- Max Lines: Sets the maximum number of lines of text.
- Text Spacing: Set the text spacing.
- Text length: Set the maximum length of the text in pixels. Line breaks will be automatically wrapped beyond this length.
- Text wrap: When enabled, text wraps the text automatically.
- Text rotation: When enabled, you can set the rotation angle. The text is rotated according to the specified angle.
- Font settings: Set the font, font size, italics, weight, underscore, and other information of the text.
- Background settings: Set the text background color, horizontal/vertical margins, background image, and other information.
- Offset Settings: Sets the X/Y axis offset relative to the interactive input anchor when the text is displayed.
- Alignment Settings: Sets the horizontal/vertical alignment information.
- Halo Settings: Set the halo effect for the text, and you can set the halo color and size.
- Shadow Settings: Set shadow effects for text, and set shadow blur and color information.