
Terrain analysis
Slope and Aspect
 Function description
The Slope and Aspect feature includes slope analysis and aspect analysis:
- Slope is the ratio of the vertical height (h) to the horizontal distance (l) of a slope surface. A larger slope value indicates steeper terrain.
- Aspect is the angle between the projection of the normal vector of the terrain surface onto the horizontal plane and true north. on the horizontal plane and the true north direction.
Tips:
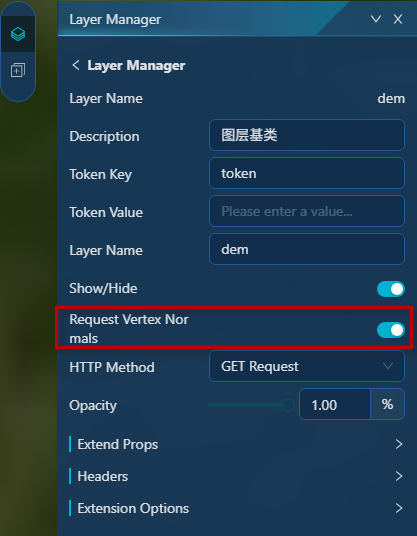
Currently, terrain analysis functions are only supported by terrain cache services that request vertex normals,and you need to enable Request Vertex Normals in Layer Management-> Layer Attribute.
 Operating instructions
1. Go to the SceneViewer view, click the "Analysis  " function in the right toolbar, and switch to the "Slope & Aspect" panel:
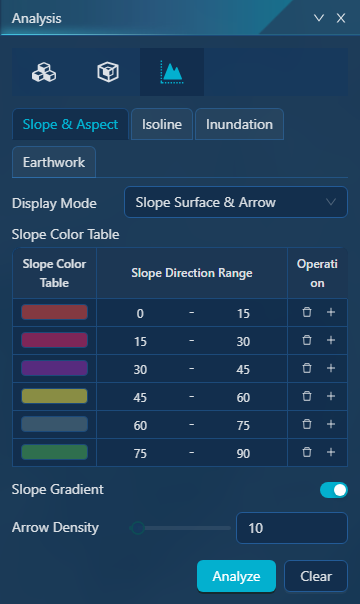
2. Select the display mode, including the following three ways:
- Slope surface: only the slope surface is displayed;
- Slope Direction Arrow: Displays only the slope arrow;
- Slope Slope Surface& Arrow: Displays both the slope face and slope arrow.
3. Set Parameter Information:
- [Slope Color Table]: can set the classification and color information of the slope;
- [Slope Gradient]: When turned on, the color gradient method is used between different classifications of slopes;
- [Arrow Density]: Set the density of arrows in the direction of the slope, the higher the value, the denser the arrows.
4. Click "Analyze" to interactively draw polygons in the scene view to perform slope slope analysis on the polygon range.
5. Click "Clear" to clear the analysis effect.
Isoline
Function description
Lsoline are lines that connect adjacent points with the same value on the surface, such as contour lines on topographic maps and isobars on temperature maps. The density of the contour distribution indicates the change of surface values to a certain extent. The denser the contours, the greater the change in surface values, and vice versa. Therefore, by studying the contours, the fundamental trend of surface value changes can be obtained.
Tips:
Currently, terrain analysis functions are only supported by terrain cache services that request vertex normals,and you need to enable Request Vertex Normals in Layer Management-> Layer Attribute.
Operating instructions
1. Go to the SceneViewer view, click the "Analysis " function on the right toolbar, and switch to the "Isoline" panel:
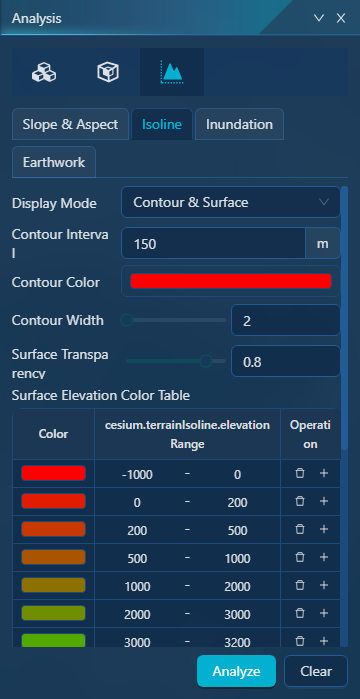
2. Select the display mode, including the following three ways:
- Contour: only contour lines are displayed;
- Contour surface: only contour surfaces are displayed;
- Contour & surface: Displays both contour lines and contour surfaces.
3. Set Parameter Information:
- [Contour Color]: contour color;
- [Contour Width]: the size of the contour line width, in pixels;
- [Surface transparency]: the transparency of the isometric color, the range is 0~1;
- [Surface Elevation Color Table]: Set the classification and color information of contour planes.
4. Click "Analyze" to draw polygons interactively in the scene view, and you can perform contour analysis on the polygon range.
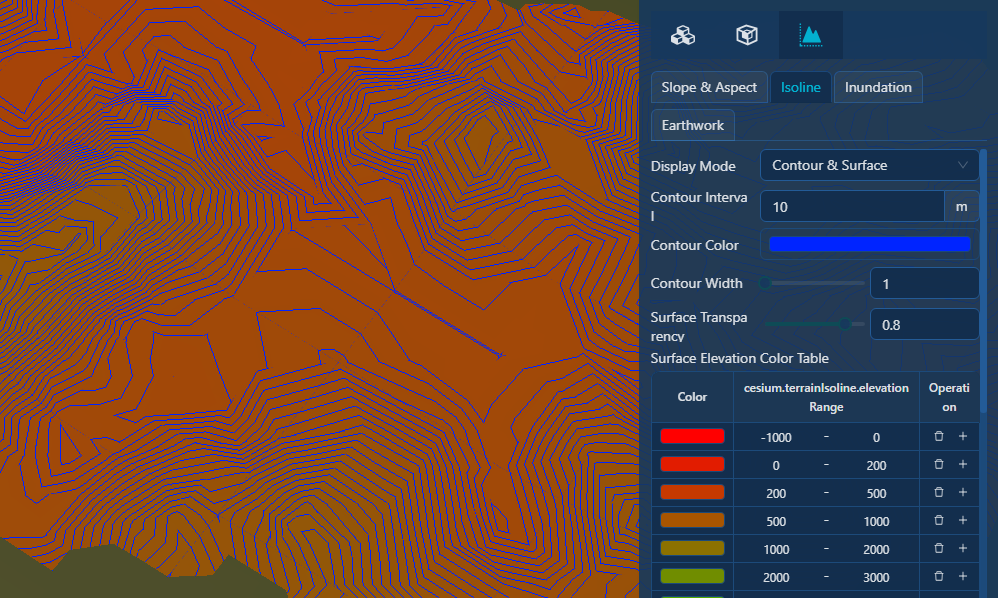
5. Click "Clear" to clear the analysis effect.
Inundation
Function description
Based on the input terrain data and flood level, the flood situation is simulated.
Tips:
Currently, terrain analysis functions are only supported by terrain cache services that request vertex normals,and you need to enable Request Vertex Normals in Layer Management-> Layer Attribute.
Operating instructions
1. Go to the SceneViewer view, click the "Analsis " function on the right toolbar, and switch to the "Inundation" panel:
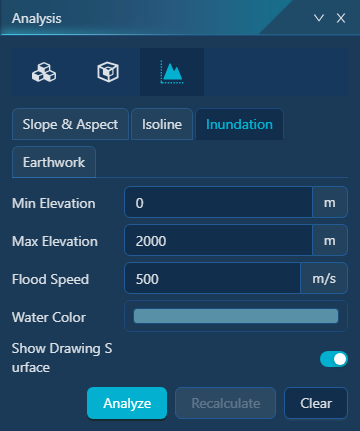
2. Set Parameter Information:
- [Minimum/Maximum Elevation]: The minimum/maximum elevation range of the flood, which is the flood area;
- [Flood Speed]: When analyzing, the submersion effect is dynamically simulated. Here you can set the speed of flood rise;
- [Water Color]: The color of the submerged area, with a translucent display.
- [Show Drawing Surface]: When enabled, the drawing surface can be displayed.
3. Click "Analyze" to interactively draw polygons in the scene view to perform a flood analysis on the polygon range.
4. Click "Clear" to clear the analysis effect.
Earthwork
Function description
The Earthwork Calculation provides the function to calculate the extent and volume of earthwork in a specified area, based on a designated leveling plane elevation.
Tips:
Currently, terrain analysis functions are only supported by terrain cache services that request vertex normals,and you need to enable Request Vertex Normals in Layer Management-> Layer Attribute.
Operating instructions
1. Go to the SceneViewer view, click the "Analysis " function in the right toolbar, and switch to the "Earthwork" panel:
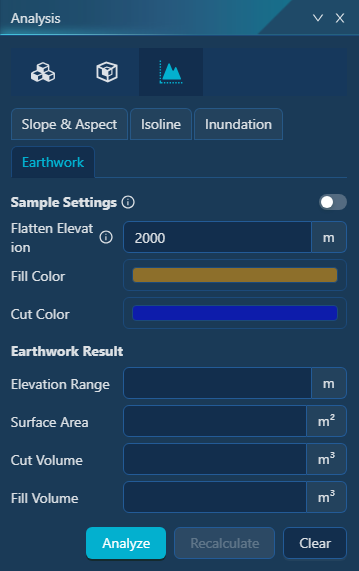
2. Set Parameter Information:
- [Sample Settings]: After enabled, the following information can be set:
- Data type: You can choose three data types: terrain, model, and scene.
- x/y sample Count: interval accuracy at sampling;
- [Flatten Elevation]: Set the regular height of filling and excavation, the area below this height needs to be filled, and the area above this height needs to be excavated;
- [Fill color]: the color of the fill area filled in based on the leveling elevation;
- [Cut Color]: The color of the cut area filled in based on the leveling elevation.
4. Click "Analyze" to draw polygons interactively in the scene view, and you can perform a earthwork analysis on the polygon range.
5. Click "Clear" to clear the analysis effect.